Translating Splunk Detections into Wazuh Rules
How to port SPL detection logic to a free SIEM: what maps cleanly, what needs a compromise, and where you write it once in Sigma and let a converter do both.
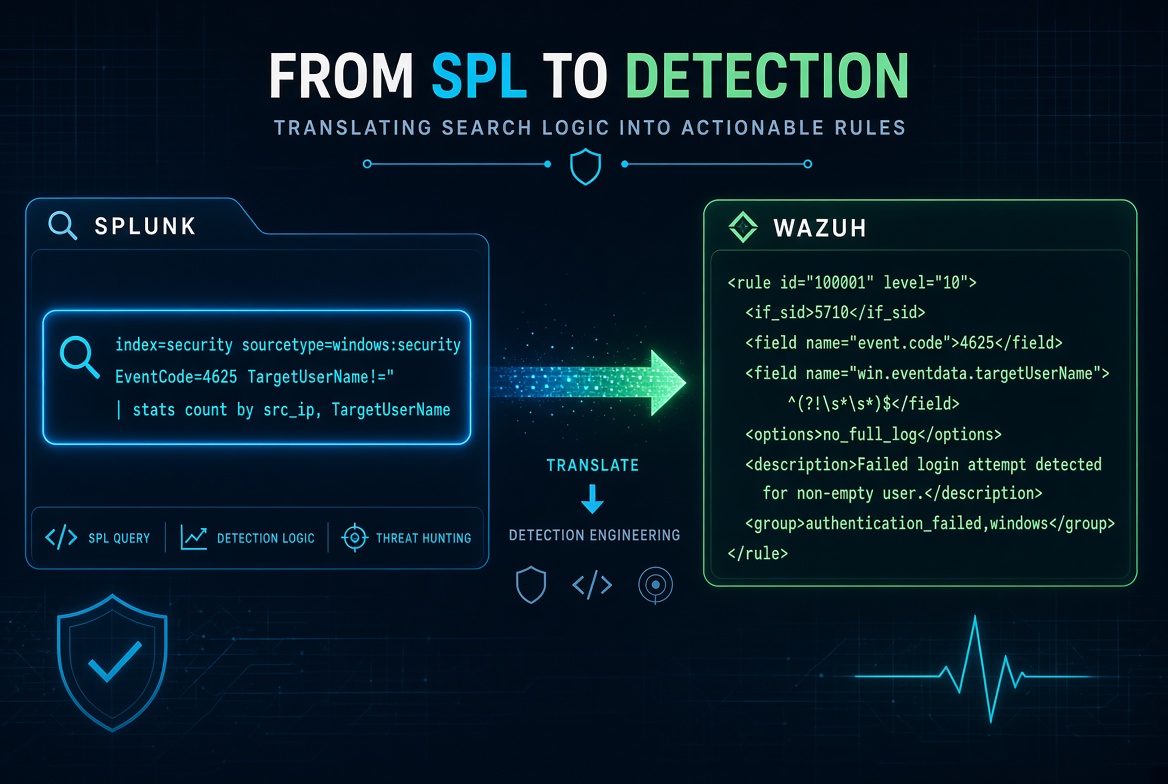
Detection engineering is mostly taught on Splunk. The labs use SPL, the courses use SPL, and a large share of the public detection content is written in SPL. Then you join a team that can’t justify the license, and the knowledge feels stuck to a product you no longer have.
It isn’t. The detection logic carries over almost completely. What changes is the engine running underneath it, and the whole skill is understanding that difference. This article takes real SPL searches and rebuilds them as Wazuh rules. The examples come from a purple-team lab (recon clustering, password spraying, Kerberoasting), sanitised to a fictional corp.lab domain but shaped the way they’d run in production. At the end there’s the shortcut most of this work has been building toward: Sigma, where you write the rule once and convert it to both.
I learned a lot of my detection engineering on the SOC Analyst path on the HackTheBox Academy platform. Big thanks to them for making such great content; if you’re interested, it’s worth checking out.
From my own experience: I was taught detection engineering on Splunk, writing SPL queries. When I wanted to take that to production I saw the price I’d have to pay, so I moved to alternatives. Wazuh worked for me, open source, and I could take most of the queries I’d written and learned on Splunk and translate them into Wazuh rules.
Setting up the environment was easy. Wazuh is simple to set up and use, but that’s not the topic of this post, maybe the next one, let me know if you’d be interested in that.
Two engines, pointed in opposite directions
Almost every awkward translation traces back to one fact: Splunk and Wazuh approach detection from different ends.
Splunk is a search-time engine. Logs get indexed and sit at rest. A detection is a query that runs over that stored data, on a schedule or on demand, and it can look backward across an entire time window in a single pass. Because the data is already sitting there, Splunk can say “count the distinct users each source IP failed against in the last ten minutes, and flag anything over seven” without breaking a sweat. It sees the whole window at once.
Wazuh evaluates one event at a time as it arrives. There’s no built-in “aggregate the window” step. A single event either matches a rule or it doesn’t. Anything that depends on several events (a threshold, a rate, a sequence) you build by chaining rules together with a small set of correlation primitives: frequency, timeframe, if_matched_sid, same_field, different_field. One rule fires based on how many times another rule has matched recently.
So the shift is this. Splunk aggregates backward over data at rest, at query time. Wazuh counts forward over a live stream and fires the instant a threshold is crossed. The alert you get is often identical. The way you write it is not.
So of course you can see the appeal: if you want to find a specific attack after it happened, on Splunk you just write a query and go look for it. It’s simpler and more effective, but it comes at a price.
If some sophisticated attack hits a Wazuh-monitored host and you don’t have a suitable rule for it, you’ll have a hard time investigating after the fact, because by default Wazuh only stores events that tripped a rule (you can enable archiving to keep everything, at a storage cost).
So we accept a tradeoff. That was my thinking behind this post: make detection engineering as free as it can be, while keeping the blindness and the gaps to a minimum.
PS: I didn’t mention it earlier, but I strongly encourage you to ship Sysmon logs from your Windows machines into Wazuh. It buys you far greater visibility.
The map
Here’s the map. Every row below shows up in the examples that follow.
| SPL construct | Wazuh equivalent | Clean? |
|---|---|---|
field=value / where match(field,"rx") | <field name="..." type="pcre2">rx</field> | yes |
field!=value / NOT | negate="yes" on the field | yes |
several AND filters | several <field> lines in one rule (implicit AND) | yes |
stats count by X | where count > N | base rule + composite with frequency + same_field = X | mostly |
stats dc(Y) by X | where dc > N | base rule + composite with same_field = X + different_field = Y | approximate |
transaction X maxspan=T | if_matched_sid + timeframe | approximate |
lookup / allowlist / enrichment | CDB lists | yes, different shape |
rex / eval / field extraction | decoders (run before rules) | yes, different layer |
eventstats / streamstats / baselining | no native equivalent | no |
If you want more constructs or fields than I cover here, look them up in the Wazuh and Splunk documentation.
Two things to pull out of that table early. Filtering and matching are a clean one-to-one, so that part’s easy. And field extraction happens somewhere else entirely. In Splunk, CIM and search-time extraction hand you tidy field names at query time. In Wazuh the decoder does that job before the rule ever runs, so your rule references a decoded path like win.eventdata.targetUserName. You have to know that path. That one detail trips up more people than anything else in this process, and there’s a fix for it further down.
Example 1: a straight filter
The easy case. A filter, no aggregation, translates line for line.
Suppose you want to flag reconnaissance LOLBins, the handful of built-in binaries an attacker runs to get their bearings on a host.
Splunk:
index=sysmon EventCode=1| where match(OriginalFileName, "(?i)^(arp|chcp|ipconfig|net|net1|nltest|ping|systeminfo|whoami)\.(exe|com)$")| table _time, Computer, OriginalFileName, ParentImageWazuh:
<group name="sysmon,attack,discovery,">
  <rule id="100300" level="3">    <if_group>sysmon_event1</if_group>    <field name="win.eventdata.originalFileName" type="pcre2">(?i)^(arp|chcp|ipconfig|net|net1|nltest|ping|systeminfo|whoami)\.(exe|com)$</field>    <description>Recon LOLBin executed: $(win.eventdata.originalFileName) from $(win.eventdata.parentImage)</description>    <mitre>      <id>T1033</id>      <id>T1087</id>      <id>T1016</id>      <id>T1082</id>    </mitre>  </rule>
</group>
Rule 100300 maps across almost line for line. EventCode=1 becomes <if_group>sysmon_event1</if_group>, matching the Sysmon Event ID 1 (process creation) class the decoder already tagged. The where match(...) becomes a <field type="pcre2"> and the regex copies over unchanged. The | table columns become the $(field) substitutions in the description. ATT&CK tags, which you’d keep as a comment or a notable-event field in Splunk, become first-class <mitre> elements.
level="3" is deliberately low. One recon command is background noise. Five from the same process in a minute is enumeration, and that’s the next example.
One big thing I didn’t put in the rule itself: as written, it will throw a lot of false positives on the machines of IT admins and network engineers, who run these commands all day. You want to restrict it to the machines where this activity is actually suspicious, a specific host or an agent group.
<hostname>SERVER-DC-01|SERVER-WEB-01</hostname>This <hostname> field tells Wazuh the rule should only apply to those machines. One catch worth knowing: <hostname> matches the Wazuh agent name, which by default is the machine’s hostname, so the values have to be the agent names as they’re registered, not arbitrary labels. If that doesn’t line up in your setup, match the Windows computer field directly instead with <field name="win.system.computer">.
PS: Detection engineering isn’t just writing rules. It’s understanding your environment first, then applying the rules and tuning out the false positives.
Example 2: a threshold on the same entity
This is stats count by X | where count > N, the backbone of behavioural detection.
Splunk:
index=sysmon EventCode=1| where match(OriginalFileName, "(?i)^(arp|chcp|ipconfig|net|net1|nltest|ping|systeminfo|whoami)\.(exe|com)$")| stats count by ParentProcessGuid| where count > 3Wazuh:
<rule id="100301" level="12" frequency="4" timeframe="60"> <if_matched_sid>100300</if_matched_sid> <same_field>win.eventdata.parentProcessGuid</same_field> <description>Recon LOLBin cluster from the same parent process - possible host enumeration</description> <mitre> <id>T1087</id> </mitre></rule>Rules 100300 and 100301 show the gap between the engines, so it’s worth being exact. The grouping key, stats count by ParentProcessGuid, becomes <same_field>win.eventdata.parentProcessGuid</same_field>: Wazuh only counts Event ID 1 matches that share the same ParentProcessGuid value. The where count > 3 becomes frequency="4" inside timeframe="60" seconds. And the whole rule hangs off <if_matched_sid>100300</if_matched_sid>, so it only counts events that already matched the atomic recon rule. You build the threshold on top of the filter instead of restating the filter.
Splunk answers “how many matched in the 60-second window I asked for.” Wazuh answers “have 4 matches with the same ParentProcessGuid happened lately” and fires on the event that tips it over the edge.
A note on frequency: it takes a value from 2 upward, and the docs describe the rule firing once the base rule has matched frequency times inside the window. The exact counting can still surprise you depending on how events arrive, so don’t trust the number on faith. Generate real traffic, watch the alert count, and tune. A threshold you haven’t fired is a guess.
You can see it takes two or more rules to do the job of a single Splunk search. Here you write one rule for the exact event, then a second that fires when that first one repeats with the same parent process GUID.
Example 3: distinct count, the one people write off
This is the one teams assume Wazuh can’t do, so they drop it. Wazuh can, and it’s two lines.
Password spraying is brute force turned inside out. Brute force is one user, many password guesses. Spraying is one source hitting many different users with one or two passwords each, low and slow, staying under the per-account lockout threshold. In SPL you express it as a distinct count:
index=wineventlog EventCode=4625| stats dc(target_user) as distinct_users by src_ip| where distinct_users > 7Wazuh’s built-in brute-force rule keys on the same user failing over and over, so it sails straight past a spray. Rule 100400 below uses different_field, which exists for exactly this shape, chained onto the 4625 failed-logon events:
<group name="windows,authentication,attack,">
  <rule id="100400" level="12" frequency="8" timeframe="60">    <if_matched_sid>60122</if_matched_sid>    <same_field>win.eventdata.ipAddress</same_field>    <different_field>win.eventdata.targetUserName</different_field>    <description>Possible password spraying: many failed logons for DIFFERENT users from one source $(win.eventdata.ipAddress)</description>    <mitre>      <id>T1110.003</id>    </mitre>  </rule>
</group>
Here’s the trick for the distinct-count pattern. The by src_ip grouping key becomes <same_field>win.eventdata.ipAddress</same_field>. The distinct-user side becomes <different_field>win.eventdata.targetUserName</different_field> plus frequency="8". So same_field is your by clause, and different_field is the closest thing Wazuh has to dc(). One honest caveat, because it matters: different_field is not a true distinct count. It increments the counter whenever the field differs from the previous match, not when it sees N unique values, so in theory two usernames alternating from one IP could also trip it. For a real spray, where many different accounts fail in sequence, it fires correctly and is the right tool; just know it’s an approximation of dc(), not an equivalent, and test it against your own traffic. Swap same_field and different_field and you flip between “same victim, many tries” and “same attacker, many victims.” That one pair of primitives covers a large chunk of real behavioural detection.
Rule 60122 is Wazuh’s existing “unknown user or bad password” rule for 4625. Confirm it’s the right base rule in your own environment first, because that base SID shifts between ruleset versions.
One thing I’ve seen with real threat actors: they space their password attempts more than 60 seconds apart, and then this rule has a problem, the window closes before the counter fills. Look at your own environment, measure how many 4625 events you normally see inside a given window, and set the timeframe from that baseline instead of from my number.
Firing it
A rule you’ve never triggered is a hypothesis. To run a real spray in a lab, pull a valid user list over LDAP first:
ldapsearch -H ldap://DC_IP -x \ -D "USER@corp.lab" \ -w 'PASS' \ -b "DC=corp,DC=lab" \ "(&(objectClass=user)(objectCategory=person))" sAMAccountName \ | grep sAMAccountName: | cut -d' ' -f2 > users.txtThen throw one password at all of them:
nxc smb DC_IP -u users.txt -p 'Spring2026!' --continue-on-successIf the rule holds, Wazuh raises the level-12 alert the moment the eighth distinct username fails from that source inside the window.
Example 4: several conditions and a negation in one event
Not everything needs correlation. Some detections are a single event that has to satisfy a few conditions at once, one of them an exclusion. Kerberoasting is the textbook case: a service ticket (4769) requested with weak RC4 encryption (0x17) for a user account rather than a machine account.
Splunk:
index=wineventlog EventCode=4769 Ticket_Encryption_Type=0x17 Account_Name!="*$"| table _time, Service_Name, Account_Name, src_ipWazuh:
<rule id="100600" level="12"> <if_group>windows_security</if_group> <field name="win.system.eventID">^4769$</field> <field name="win.eventdata.ticketEncryptionType">^0x17$</field> <field name="win.eventdata.targetUserName" negate="yes" type="pcre2">\$$</field> <description>Possible Kerberoasting: RC4 (0x17) service ticket for SPN $(win.eventdata.serviceName) requested by $(win.eventdata.targetUserName)</description> <mitre> <id>T1558.003</id> </mitre></rule>Three things to take from it. Multiple <field> lines are an implicit AND, so every condition has to hold for the one event; that’s your space-separated SPL filter. Exact values need anchors, so ^0x17$ means exactly that string, the way Ticket_Encryption_Type=0x17 does; drop the anchors and a bare value becomes a substring match, which is a quiet source of false positives. And negate="yes" is your !=: excluding machine accounts (Account_Name!="*$", names ending in $) becomes a negated field matching \$$.
Proving it fires
The cleanest proof is the real alert. When a Kerberoast request hit the lab DC, rule 100600 fired on the live pipeline. Trimmed and sanitised:
{ "rule": { "id": "100600", "level": 12, "description": "Possible Kerberoasting: RC4 (0x17) service ticket for SPN svc_sql requested by j.doe@CORP.LAB", "mitre": { "id": ["T1558.003"], "technique": ["Kerberoasting"], "tactic": ["Credential Access"] }, "firedtimes": 1 }, "decoder": { "name": "windows_eventchannel" }, "location": "EventChannel", "data": { "win": { "system": { "eventID": "4769", "channel": "Security", "computer": "DC01.corp.lab" }, "eventdata": { "targetUserName": "j.doe@CORP.LAB", "serviceName": "svc_sql", "ticketEncryptionType": "0x17", "ipAddress": "::ffff:10.10.0.55" } } }}That is the whole contract on a real event: a 4769 with RC4 (0x17) and a non-machine requester, decoded by windows_eventchannel, matched by rule 100600 at level 12 and tagged T1558.003.
One honest note on wazuh-logtest for a rule like this. If you pull the raw event out of full_log and paste it into logtest, the generic json decoder grabs it, not windows_eventchannel. The fields still decode, but the windows_security group never gets set (that comes from the base windows rule chain, which keys on the eventchannel decoder), so a group-chained rule like 100600 won’t light up there, it falls through to a generic rule. logtest shines for standalone field-match rules; for eventchannel rules that ride the windows group chain, the live alert above is the simpler check. Forcing logtest to fire it means temporarily pointing the base windows rule at the json decoder and reverting after, which is more trouble than it’s worth for a quick sanity check.
Two edges define what this rule does and doesn’t catch. A machine account requesting the ticket (a name ending in $) is dropped by negate="yes". And an AES ticket (ticketEncryptionType 0x12) never matches ^0x17$, so an attacker who requests AES walks straight past an RC4-only Kerberoast rule. That last one is the honest gap: this catches the common, lazy Kerberoast, not the operator who downgrades on purpose.
This one stays quiet in a clean domain. Be careful in a large one where some legacy services still legitimately use RC4, because there your 0x17 baseline is higher and you’ll want an allowlist. Which is the next piece.
The Splunk lookup, rebuilt: CDB lists
A lot of what makes a Splunk detection good is lookup: enriching or filtering events against an external table of known-good service accounts, asset owners, expected SPNs. Teams moving to Wazuh often don’t realise there’s an equivalent and end up hard-coding exceptions into rule regexes, which rots fast.
The equivalent is a CDB list, a flat key:value file Wazuh loads so rules can test membership against it. For the Kerberoasting rule, you might keep a list of accounts allowed to use RC4 and suppress alerts for them.
The list file, etc/lists/rc4_allowed_accounts:
legacy-sql-svc:old-backup-svc:Referenced from a rule with <list> and a key:
<rule id="100601" level="2"> <if_sid>100600</if_sid> <list field="win.eventdata.targetUserName" lookup="match_key">etc/lists/rc4_allowed_accounts</list> <description>Kerberoast pattern from allowlisted RC4 account - downgraded</description></rule>It’s the same idea as a lookup-based allowlist in SPL: keep the exceptions in data, not in logic. CDB lists also match CIDR ranges, which is handy for muting scanner and vuln-management source IPs without touching a single rule.
Write it once: Sigma as the shared source
By now you’ve probably hit the obvious question. If the logic’s the same and only the syntax differs, why write it twice at all?
That’s exactly what Sigma is for. Sigma is a vendor-neutral detection format written in YAML. You describe the detection once, then a converter compiles it to the query language of whatever platform you’re running. One rule, many backends. It’s the lingua franca the two halves of this article have been circling.
A Sigma rule has a logsource (which logs it applies to) and a detection block made of named selections and a condition that combines them. Here’s the Kerberoasting detection from Example 4 as Sigma:
title: Kerberoasting - RC4 service ticket requestid: 480f17fe-d866-49fd-b4e9-09398b0605d0status: experimentallogsource: product: windows service: securitydetection: selection: EventID: 4769 TicketEncryptionType: '0x17' filter_machine: TargetUserName|endswith: '$' condition: selection and not filter_machinetags: - attack.credential_access - attack.t1558.003Hold it up against the Wazuh rule 100600 you already wrote. selection is the set of AND conditions, the same stack of <field> lines. filter_machine with not in the condition is the negate="yes" exclusion. The tags are the <mitre> block. You’re describing the same detection, one level up.
To convert it you run sigma-cli, which sits on top of the pySigma library and its per-product backends:
# Splunk SPL (official backend, install it first)sigma plugin install splunksigma convert -t splunk -p splunk_windows kerberoast.ymlFor Splunk this is a solved problem. For Wazuh it is not: there is no official pySigma Wazuh backend or -t wazuh target in the plugin directory. Conversion to Wazuh XML relies on community tooling instead, such as SigWaz (sigwaz.com) or one of the community pySigma backends you install yourself. Run sigma plugin list to see what targets are actually available to you before assuming one exists.
The -p splunk_windows flag is a pipeline, and it’s doing the field-mapping work I flagged earlier. A pipeline translates Sigma’s generic field names into the ones a product actually uses, so Sigma’s EventID and TargetUserName resolve to the Splunk Windows fields the backend expects. It’s the Sigma answer to “know your field names,” handled once in a pipeline instead of by hand in every rule. The Wazuh-side mapping (to paths like win.system.eventID and win.eventdata.targetUserName) is the piece the community converters have to solve themselves, and it’s the main reason their output still needs a human pass.
Be honest about the state of the tooling, because it’s lopsided. The Splunk backend is mature and officially maintained. Wazuh has no official backend at all, so everything runs through community converters whose coverage varies, and known gaps bite here: field mapping, severity-to-level mapping, if_sid wiring, and anything with an aggregation or timeframe tend not to come out clean. Treat whatever XML you get as a first draft you read and finish yourself, never a final rule.
And the gap you’d expect from the rest of this article shows up in Sigma too. Simple field-match rules like the one above convert cleanly to both targets. The correlation rules (thresholds, distinct counts, sequences) live in Sigma’s newer correlation syntax, and that’s precisely where backend coverage is thinnest. The hard patterns stay hard. Sigma makes you maintain one source of truth and removes the mechanical retyping; it doesn’t paper over the engine differences the first half of this article is about. That’s the right way to hold it: a maintenance and portability win, not a magic one.
For a team with the knowledge but not the budget, the workflow that tends to pay off is a hybrid. Keep your atomic and simple-threshold detections in Sigma so they’re portable and reviewable in version control, convert them into Wazuh, and hand-write the handful of correlation rules where the converter can’t help yet. You get most of what a managed detection pipeline buys you for the price of a YAML folder and a Git repo.
Where Wazuh can’t follow
Some SPL has no Wazuh equivalent, and pretending otherwise ships detections that don’t work.
The big one is statistical baselining, eventstats and streamstats. A rule like “flag a user whose logon count today is three times their thirty-day average” needs an aggregate computed across the dataset and compared per event:
index=wineventlog EventCode=4624| eventstats avg(logon_count) as baseline by user| where current_count > baseline * 3Wazuh has no native way to hold a rolling per-entity baseline and test against it. The realistic moves are three. Push the statistical layer elsewhere: keep Wazuh for atomic and threshold detections and run baselining on the indexer side (the Wazuh stack is built on OpenSearch, whose Anomaly Detection plugin is disabled by default but installable, and Wazuh publishes a guide for wiring it to alert data) or in a small cron job that reads the alert index and writes back a notable event. Or approximate with a fixed threshold: you lose the adaptive quality, but a sensible frequency catches the gross anomalies with a fraction of the engineering, so start there and only build the stats layer if the fixed number proves too noisy or too blind. Or accept the gap and write it down, because a documented coverage gap is an engineering decision and an invisible one is a liability.
True multi-step sequences are the other soft spot. A transaction with ordering and a max span (“process A spawned B, which then made an outbound connection, in that order”) only approximates in Wazuh through chained if_matched_sid rules on a timeframe. You get the “these related things happened close together” part. Strict ordering and arbitrary grouping are weaker, and for forensic reconstruction that’s a job for the data layer anyway.
A method you can repeat
Instead of memorising the table, run every SPL detection through the same five questions.
- What is the search actually doing? Strip it to its verbs. Filtering, counting (
stats count by), distinct-counting (dc()), sequencing (transaction), or enriching (lookup)? The verb decides the Wazuh shape. - What are the real field paths? This is the step people skip and then lose an afternoon to. Fire the event once in your lab, read the decoded JSON from the dashboard or straight out of
/var/ossec/logs/alerts/alerts.json, and copy the path exactly:win.eventdata.targetUserName, notAccount_Name. Or let a Sigma pipeline handle it. Either way, verify; don’t assume. - Map the filter. Field matches to
<field type="pcre2">, exclusions tonegate="yes", multiple conditions to multiple<field>lines. - Map the aggregation. The
bykey issame_field. A plain count isfrequency. A distinct count isdifferent_field. Build it as a composite on top of the atomic rule withif_matched_sid. - Handle the leftovers. Enrichment goes to a CDB list. Baselining goes to an external stats layer or a tuned fixed threshold. Anything you can’t cover, document.
- Always test your rules against real logs with
wazuh-logtestbefore you trust them.
Then fire the attack and confirm the alert fires. Every single time.
Closing
The gap between “I can write detections” and “I can run detection coverage on a free SIEM” is mostly a translation problem, and a short one. Filtering is one-to-one. Thresholds and distinct counts go through frequency, same_field, and different_field. Enrichment moves into CDB lists. Sigma keeps a single portable source. Only statistical baselining really falls outside Wazuh, and even that has workable answers.
If that’s your situation, Splunk skills and no Splunk, you’re not starting from zero. You’re porting. Start with your highest-value atomic detections, add the threshold layer, push the shared ones through Sigma, lean on CDB lists for the exceptions, and stay honest in writing about the few things that need another layer. That’s a real detection program on open-source tooling.